AI Reports & Insights
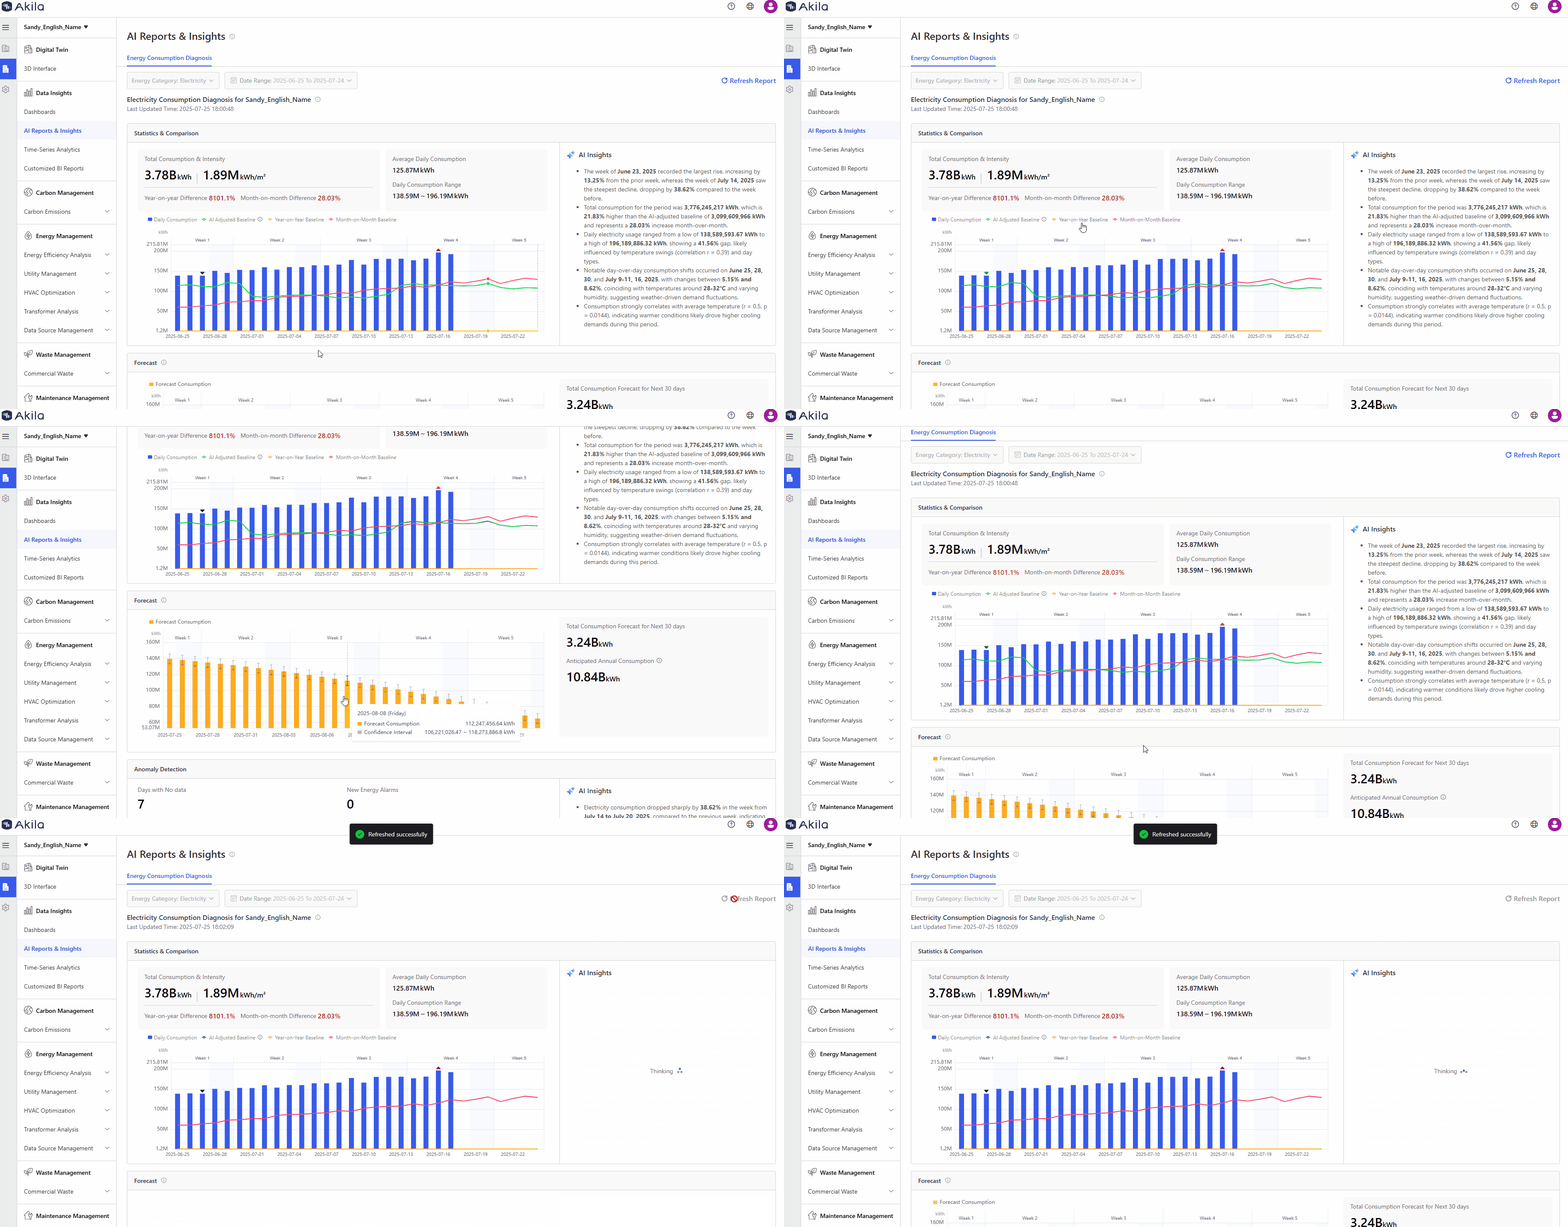
This page leverages cutting-edge AI to deliver in-depth energy analytics, transforming raw data into actionable operational intelligence. Going beyond simple alarm monitoring, it intelligently correlates energy consumption with efficiency indicators. The system generates tailored optimization recommendations complete with projected savings estimates, all presented through this intuitive interface.
You can use it to:
- transform raw data into actionable operational intelligence, delivering deeper energy consumption analysis
- help you to reduce energy costs, enhance efficiency, and make smarter operational decisions.
View Dashboard
Tips: If there is some access limited, please contact Akila deliver team for help. If you view "Go to Data Source Management" when entering this page, please make the configuration firstly.
- Select Date Range and Objects
- Click Refresh
Notes: Once saved, the filter settings will become the default configuration for all users accessing this page and remain effective until modified by another user with equivalent permissions. - View Statistics & Consumption
Notes: AI will give you corresponding insights to make better decisions. The chart uses intuitive visual cues to highlight key data patterns: The highest usage bar displays a red superscript indicator, while the lowest shows a green subscript. Missing data points appear as distinct dot markers at line breaks, with detailed information available via hover tooltips. For day-over-day comparisons, values exceeding +15% change appear in red, while those dropping below -15% display in green, providing immediate visual feedback on significant consumption fluctuations. - View Forecast
Notes: AI will predict future consumption based on historical data and trends. - View Anomaly Detection
Notes: AI identifies irregularities and provides actionable insights. Clicking "View More" under the new energy alarms section will direct you to the Alarm Log page, where the data is automatically filtered to show energy usage alarms from the last 30 days. Similarly, selecting "View More" under either AI-detected or manually flagged abnormal consumption will take you to the Raw Data Point page, with pre-set filters displaying records marked as abnormal (either by AI or manual selection) within the past 30 days. - Click "Refresh Report"
Notes: Update to the latest data (max 3 refreshes per day per site).
